Category Management
Salient’s category management templates enable users to evaluate and explore areas including:
- Promotions & Price Analysis, Pricing Ranges & Outliers
- Price Change Impact & Elasticity of Demand Tracking
- Optimal Product Mix / Product Assortment & Cannibalization
- Selling Space Optimization
- Competitor Price Comparisons
- Lost Sales & Placements
- Potential Voids & Out of Stock Exception Reporting
- Key Account & In-Store Reviews
- Category Rankings & Overviews
- Private Label Share
Price Trend Analysis
The Salient trend analysis has pre-programmed hot spots to lasso periods on the chart to provide popups indicating totals and averages per week so the impact of price changes, promotions, plan-o-gram resets or other decisions can be very easily measured and annotated.
Minimizing Out of Stocks
Our out-of-stock analysis template helps managers identify potential distribution, supplier, or store-level execution issues.
Users can adjust their focus to look at various aggregate levels by customer and product (such as by Channel, Market Area, Chain, Banner, Supplier, Brand, Package, or SKU) to determine the frequency and value of potential out-of-stocks, or even expose potential issues at the supplier level.
Store & SKU Level Drilldown
Drill down in the Product List to visualize gains and losses by store across a gauge trellis. Double-clicking any row on the right, and re-grouping data as needed will filter the gauges, as well as the corresponding trends by store.
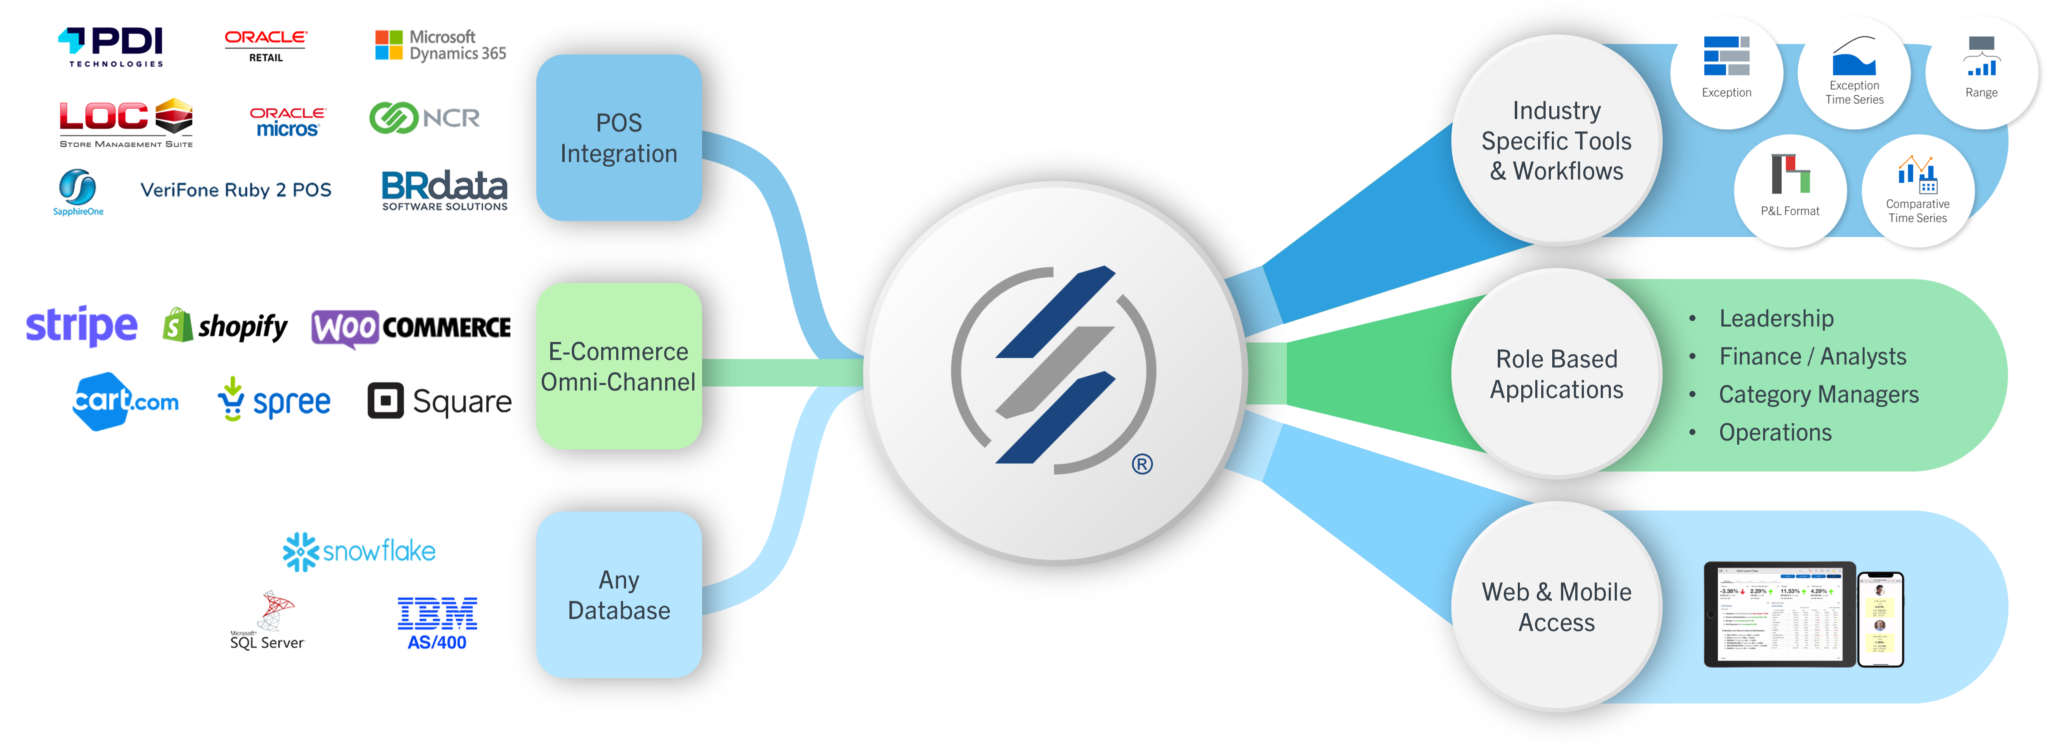
How Our Solution Works