Supermarket & Convenience
Salient’s analytic solution gives today’s omnichannel retailer the ease of use and quality insights to make faster and more productive data-driven decisions across every area of the organization.
Both our preset interactive retail templates and our ad-hoc data exploration capability gives retailers actionable insights into critical data points including product & category trends, operational effectiveness, inventory & supply chain performance, and consumer buying patterns. Salient helps retailers identify the key factors which most affect overall profitability.
Salient’s Industry Templates Provide a Custom Starting Point for Business Users
- Merchandising & Category Management
- Supply Chain & Inventory Management
- Operations Management
(General, Department, Warehouse) - Production Management
(Kitchen, Prepared Foods) - Financial Management
(P&L, Daily Sales, Analyst Reports)
Category Management
Salient’s category management templates enable users to evaluate and explore areas including:
- Promotions & Price Analysis, Pricing Ranges & Outliers
- Price Change Impact & Elasticity of Demand Tracking
- Optimal Product Mix / Product Assortment & Cannibalization
- Selling Space Optimization
- Competitor Price Comparisons
- Lost Sales & Placements
- Potential Voids & Out of Stock Exception Reporting
- Key Account & In-Store Reviews
- Category Rankings & Overviews
- Private Label Share
Pricing & Promotion Trends
Whether your pricing involves a specific strategy such as an EDLP, a high/low calendar, or is being supported via CPG Supplier promotion programs, historical and post-event analysis is still critical in improving impacts at every turn. Our templates leverage automated, dynamic text to indicate significant changes as well as sections for manual write-ups where users can input their explanation of findings.
Salient’s time-series charts also include areas for placing notes to describe specific timeframes along with the overall trend. In this example, annotations have been added to explain percent drops in sales and profit due to ineffective pricing that occurred for the span of a few months. Our templates can also be loaded with client-gathered pricing information from surveys as well as syndicated sources such as Nielsen, IRI, and Retail Velocity.

Promotions & Price Analysis, Pricing Ranges & Outliers

Price Change Impact & Elasticity of Demand Tracking
Optimal Product Mix / Product Assortment & Cannibalization

Selling Space Optimization
Out of Stock
Our out-of-stock analysis template helps managers identify potential distribution, supplier, or store-level execution issues.
Users can adjust their focus to look at various aggregate levels by customer and product (such as by Channel, Market Area, Chain, Banner, Supplier, Brand, Package, or SKU) to determine the frequency and value of potential out-of-stocks, or even expose potential issues at the supplier level.
Store & SKU Level Drill Down
Drill down in the Product List to visualize gains and losses by store across a gauge trellis. Double-clicking any row on the right, re-grouping data as needed will filter the gauges, as well as the corresponding trends by store.
Supplier Portals
Give your vendors improved visibility into actual consumer demand. Allow them to better control stocking levels and improve their fill rates.
Salient Works With Major Supermarket & Convenience Stores Like:


“We researched multiple options and found that there is no other solution that understands the grocery business like Salient. Not only does the solution provide information needed to make better decisions, the Salient team understands the questions we are asking and why getting answers to those questions matters to our business. In addition to understanding our business, they possess a robust platform, capable of delivering timely, granular-level information on an impressively large scale.”
Andrea Chase
Vice President, Category Management
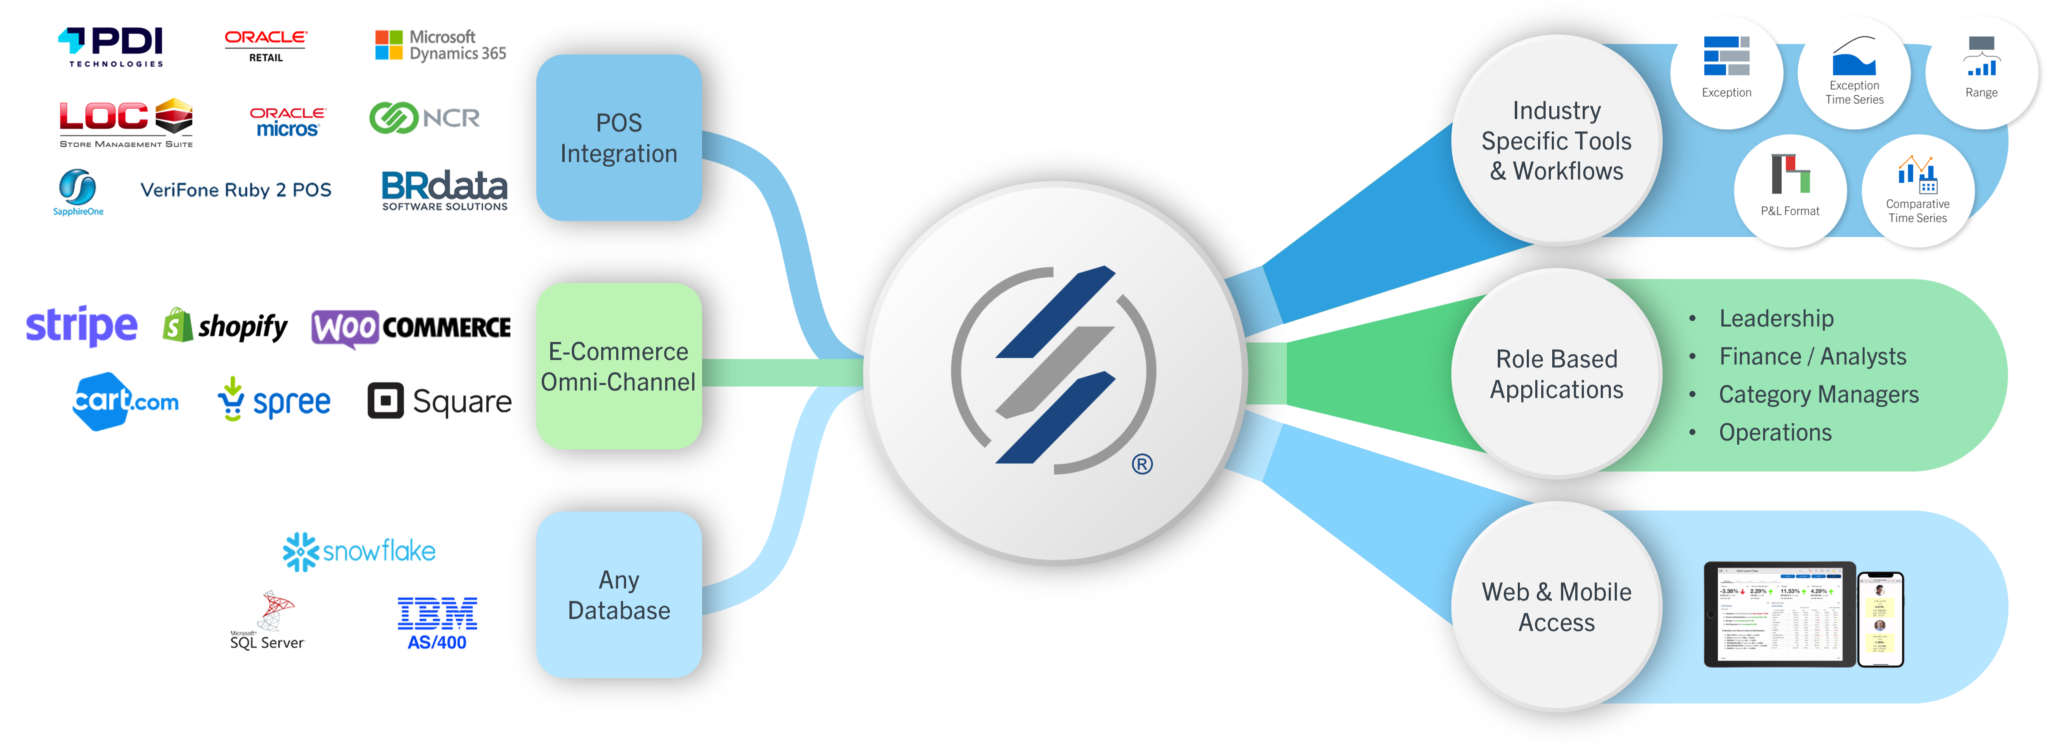
How Our Solution Works
Get Started Today