Salient Dashboard Miner
Salient Dashboard Miner delivers a fully flexible, web-based dashboarding platform that gives users the ability to freely investigate and explore on their own. And with Salient’s pre-built best practice dashboard templates, your users can have direct guidance in identifying the best focus areas to drive outcomes more effectively.
Seamless Exploration to Root Cause Detail
Interrogate in any direction. Drill deeper into gains & losses in any area of the business, for any timeframe. Ask and answer any questions on the fly.
- Fully interactive, drillable charting throughout
- Best Practice templates included
- Lockable Filters to keep focused in on your area of responsibility
- Augmented with dynamic indicators, notifications and exception reporting
- Support for ‘Storytelling’ dynamic insights for consistent interpretation
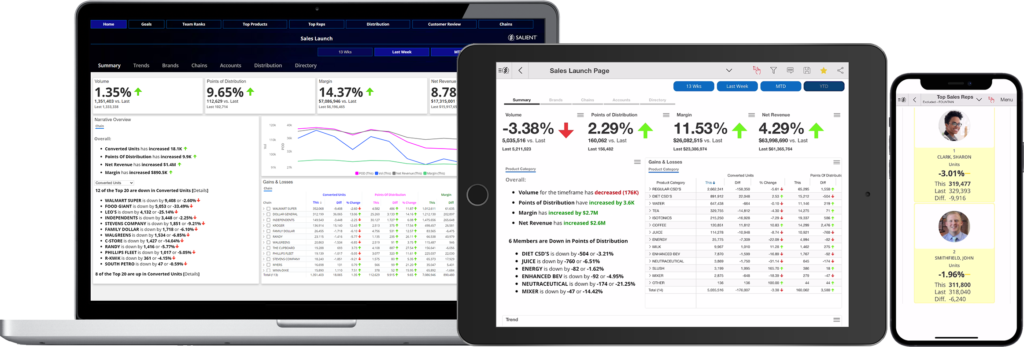
- Viewable on web browser and the Salient Mobile app for iOS and Android
- Completely secure hosting available
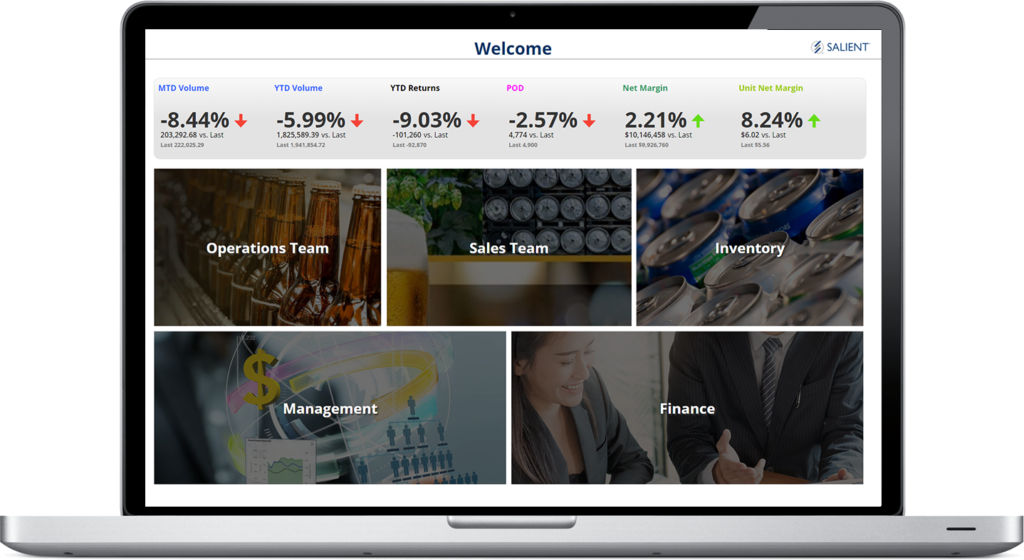
Embedded Best Practices
Salient has studied common sales roles like chain account managers, area sales managers and others, and we’ve created best practice templates to support the most relevant use-cases that can aid your business users in making the most positive impacts.
Our pre-packaged analytics make a great place to start and can easily be tailored. Creating new interactive, drillable dashboards can be a truly self-service experience, but instead of leaving you with a blank slate, we jump-start your time-to-value with industry solutions that include pre-built exception tests, analysis paths, and fully interactive visualizations.
Drag & Drop Design. No Coding Needed.
Dashboard Designer users can enjoy the ease of building fully interactive dashboards for their end-user audiences with an intuitive drag-and-drop user interface, Salient Dashboard Miner™ (SDM).
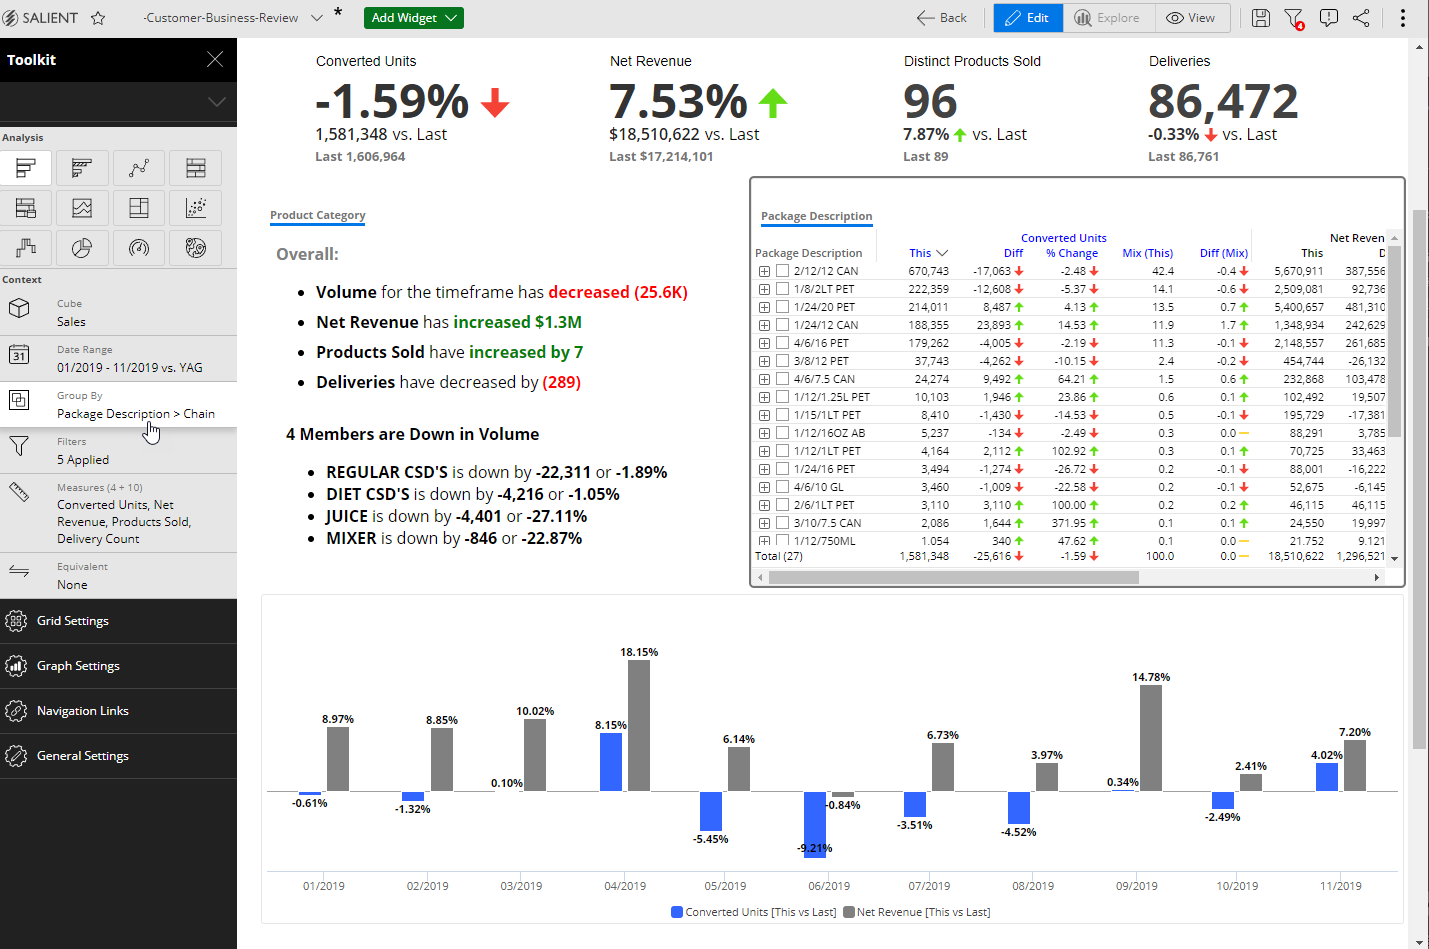
Efficient Building Workflow
Through SDM’s Toolkit, builders can design the dashboard and its widgets using the numerous setup options located along the left side of the builder interface. Builders can select from numerous chart types, adjust timeframes, add dimension groups, sort drill-paths, insert measures, apply filters, adjust table layouts, name the widget titles, and enable or disable various interactions for the selected widget.
Flexible, Drillable Graphs and Charts
Explore Beyond Any Point
Drill Directly Into Outliers
Compare Timeframes in Trends
Drill and Regroup
Interrogate Any Chart
Get to Actionable Lists Instantly
See More on our Analysis Examples Page
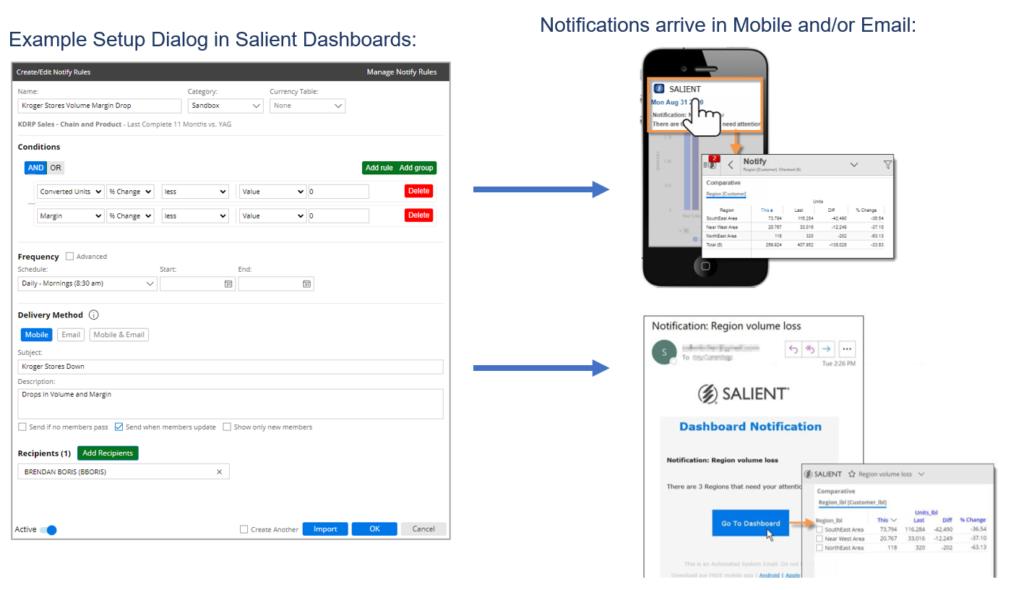
Set Automated Notifications
Mobile Notifications appear on mobile devices just like other notifications – immediately alerting users of a significant shift in performance. Users can tap to see details and interact, drill to other sub-categories for further insight.
Email Notifications allow users to launch a web-based dashboard to further explore potential issues. The Salient Dashboard Miner installation comes with a formatted email template which can be customized to fit your organization’s brand guidelines.
Our Clients